


Next: 2.1.1 線形-線形グラフ
Up: 2 なぜ対数グラフを使うのか
Previous: 2 なぜ対数グラフを使うのか
前節の対数軸をとったグラフが対数グラフである。対数軸では式(1)に示すように値の を取った長さで表されるため、
 値
と長さの関係が線形のグラフになる。
図6に分かりやすいように二重に軸を表示したグラフを示す。片方の軸のみ対数軸にしたグラフを片対数グラフ、両方の軸を対数軸としたグラフを両対数グラフと呼ぶ。黒の線と数字がグラフに通常書かれる線と値で、緑色が10で対数をとった
値
と長さの関係が線形のグラフになる。
図6に分かりやすいように二重に軸を表示したグラフを示す。片方の軸のみ対数軸にしたグラフを片対数グラフ、両方の軸を対数軸としたグラフを両対数グラフと呼ぶ。黒の線と数字がグラフに通常書かれる線と値で、緑色が10で対数をとった
 、
、
 の値と線である。
図 6:
色々な軸のグラフ
![\begin{subfigure}
% latex2html id marker 432 [b]{0.5\linewidth}
\centering
\in...
...ce{3mm} %pdfでのみつまる対策
\caption{線形グラフ}
\end{subfigure}](img39.png)
(a) 線形グラフ
|
![\begin{subfigure}
% latex2html id marker 439 [b]{0.5\linewidth}
\centering
\in...
...3mm} %pdfでのみつまる対策
\caption{片対数グラフ}
\end{subfigure}](img40.png)
(b) 片対数グラフ |
|
![\begin{subfigure}
% latex2html id marker 446 [b]{0.5\hsize}
\centering
\includ...
...3mm} %pdfでのみつまる対策
\caption{片対数グラフ}
\end{subfigure}](img41.png)
(c) 片対数グラフ
|
![\begin{subfigure}
% latex2html id marker 453 [b]{0.5\hsize}
\centering
\includ...
...3mm} %pdfでのみつまる対策
\caption{両対数グラフ}
\end{subfigure}](img42.png)
(d) 両対数グラフ |
|
|
それぞれのグラフの特徴の比較のため線形関数(
 )、べき関数(
 )、指数関数(
 )、対数関数(
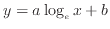 1)をグラフに描いてみる。それぞれの関数に対して次式を例としてグラフに描く。
それぞれの関数の対数軸を取ったグラフでの形は次のように求められる。対数軸では値の 、
、 に対して10の対数を取った次式で表される
 、
、 との関係が表される。
上式を変形する。
この関係を対数軸をとる変数へ代入し、対数軸では
、
、通常の軸では
、
との関係を見ればどのような形のグラフとなるか分かる。
それぞれの式のそれぞれのグラフへの対応を見ていく。
Subsections
Next: 2.1.1 線形-線形グラフ
Up: 2 なぜ対数グラフを使うのか
Previous: 2 なぜ対数グラフを使うのか
関連する記事
・この記事の新しい版
対数グラフ 2020.03.25版
この図を含む文章の著作権は椿耕太郎にあり、クリエイティブ・コモンズ 表示 - 非営利 - 改変禁止 4.0 国際 ライセンスの下に公開する。最新版はhttp://camellia.thyme.jpで公開している。